
With an objective of understanding vehicle purchase behaviour and changing perceptions in the wake of COVID-19 in India, CarWale, India’s largest auto media vehicle, undertook the country’s largest, most widespread, and deep-rooted survey of potential four-wheeler and two-wheeler customers across the country. The Indian Automotive Consumer Canvass (IACC), as the survey was called, garnered a total of 202,334 responses over the survey period.
The survey, which was supported by CEAT Tyres, IndusInd Bank and Frost & Sullivan, found an upswing in interest in Electric Vehicles (EV) with a willingness to explore new models in ownership and a sharp uptick in interest in online purchases.
Executive Summary
Listed below are the critical findings of the survey as well as the panel discussion that followed with key stakeholders from the industry.
A. PHYGITAL SHOWROOM CONCEPTS AND ASSET-LIGHT OWNERSHIP MODELS DRIVING CHANGE IN INDIA.
1. Nature of ownership shifting towards asset-light models:
- Larger demand for hatchbacks in the industry – share of hatchback demand for Maruti Suzuki is about 47% in 2020, which has gone up from about 45-46% in 2019.
- For MSIL, number of first-time-buyers (FTBs) has gone up by 5%, who have moved away from public transport. Number of replacement buyers has come down by about 7%.
2. Open Innovation platform with multi-brand multi-segment products:
- “Modular Customisation” can be leveraged for revenue generation.
- Leisure driving/ motorsport community needs to be integrated.
- Choice of safety technologies still not an “investable” proposition in India. Need for a “conscious marketing” of technologies that save peoples’ lives needed.
3. Phygital shift transforming dealership infrastructure:
- Metro dealers quicker to adapt, while Tier 2 & Tier 3 dealers take time to embrace digital solutions.
- Managing customer-diversity is biggest challenge for a dealership. Personal relationship is still driving business and sales.
- “Fun of Negotiating” on the purchase price done only at dealership.
B. SEAMLESS CONNECTIVITY AND ON-DEMAND SERVICES DRIVING ADDITIONAL REVENUE GENERATION
1. Pay-per-use tyres to become prevalent with large fleet operators:
- Diagnostics, wear & tear patterns, usage characteristics, and fuel efficiency improvements driving technology adoption by fleet operators.
- Fitment fulfilment key for tyres purchased online. Partnering with local start-ups, which can support customers locally. CEAT doing pilots in Delhi, Mumbai, Bangalore and Hyderabad.
2. Insurance sector adopting new models such as “video branch”:
- Customer interaction and executing of financing agreement is virtual and seamless.
- People >50 years of age buying cars now – both new and pre-owned. Demand from “elderly customers” for vehicle purchase – agnostic about new/ pre-owned.
- Spurt in women buying 2Ws (scooters) in Tier 2 & Tier 3 cities driven by convenience and safety.
3. Demand for financing driven by Tier 2 & Tier 3 cities in India:
- Re-finance/ pre-owned vehicle finance – encouraged. Top-up loans for existing customers used as a tool to attract customers and build a long-standing relationship.
- Existing customers given a pre-approved loan document, which requires no documentation.
- Niche market in SEP (self-employed professional) and SENP (self-employed non-professional).
Detailed Analysis
Q1. INTENT TO PURCHASE A VEHICLE THIS YEAR (2021)
The first question of the IACC focused on understanding the consumers’ intent to purchase a vehicle this year. This question was mandatory for all respondents to answer.
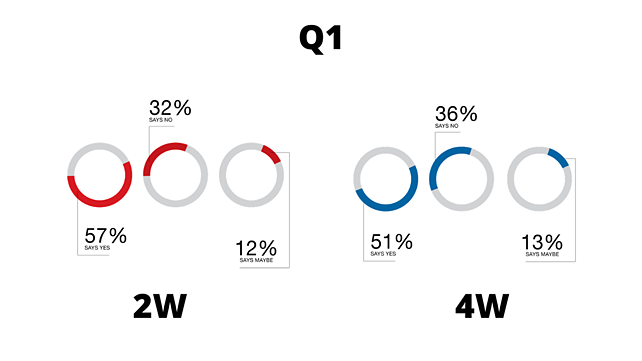
More than half of the respondents intend to purchase a vehicle in the current year, whereas just over a third does not. In percentage terms, 54% responded positively to the question, while 34% replied with an absolute ‘no’. The remaining 12% of the respondents weren’t sure of their intent this year, and responded with a ‘maybe’.
Specifically, in the two-wheeler survey, 57% of the respondents opted positively, while 32% responded in negative. Among four-wheeler respondents, 51% and 36% responded with a yes and no respectively.
Q2. CHANGE IN DECISION SINCE OUTBREAK OF COVID-19 PANDEMIC
(Base Description: Those who said “Yes”/ “May be” in Q1)
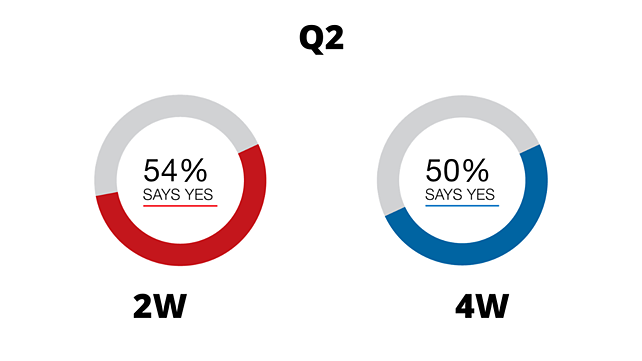
Over half of the respondents (54% in 2W and 50% in 4W) mentioned that their decision has changed since the outbreak of the COVID-19 pandemic.
Q3. PURCHASE POSTPONEMENT DUE TO THE COVID-19 PANDEMIC
(Base Description: Those who said “Yes” in Q2)
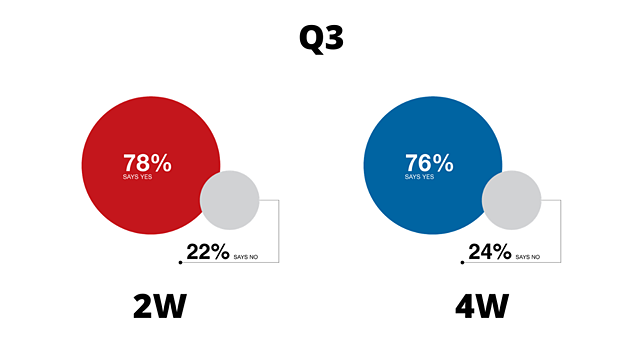
An estimated 77% of the respondents postponed their decision to purchase vehicles due to the outbreak of COVID-19 pandemic. There wasn’t much difference in choice between 2W (78%) and 4W (76%) respondents.
Q4. MONTHS OF POSTPONEMENT IN VEHICLE PURCHASE DECISION
(Base Description: Those who said “Yes” in Q3)
On average, the decision for vehicle purchase has been postponed for seven months.
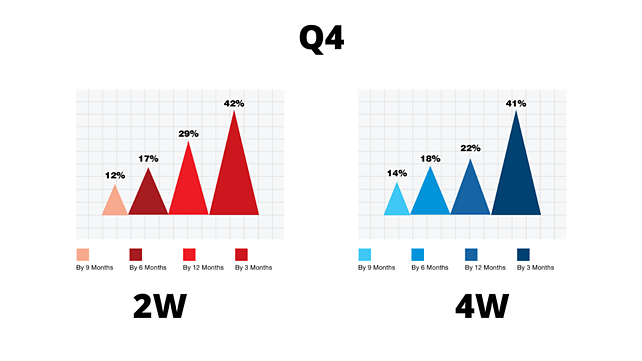
In the 2W category, an estimated 42% of the respondents wish to postpone their vehicle buying decision by about three months, while 17% is looking at a six month deferment and 12% respondents at a nine month deferment of their vehicle purchases. A significant 29% of all respondents to this question want to push their purchases by a year.
Likewise, in the 4W segment, 41% wishes to defer their vehicle purchase by three months, 18% by six months, 14% by nine months and 22% of the respondents wishes to push their vehicle purchase by 12 months.
Q5. DECISION TO UPGRADE OR DOWNGRADE THE VEHICLE CHOICE
(Base Description: Those who said “Yes” in Q2)
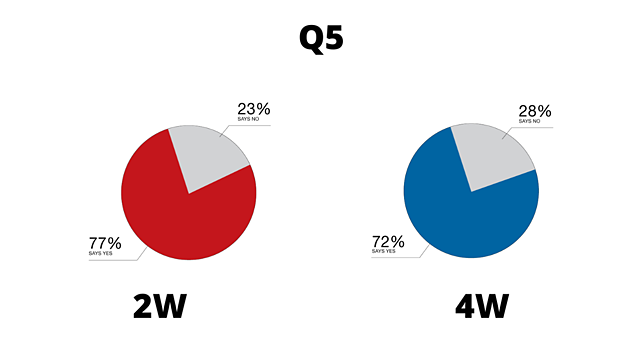
Has the COVID-19 outbreak altered consumers’ decision to upgrade or downgrade their vehicle choice? A significantly high number of respondents – about three-fourth (74%) – responded positively to this this question. The split in choice between 2W and 4W customers wasn’t much, as 77% of potential 2W customers and 71% of potential 4W customers responded by saying COVID-19 indeed altered their decision to upgrade or downgrade their vehicle choice.
Q6. CHANGE IN VEHICLE PURCHASE BUDGET OVER LAST YEAR
(Base Description: Those who said “Yes” in Q5)
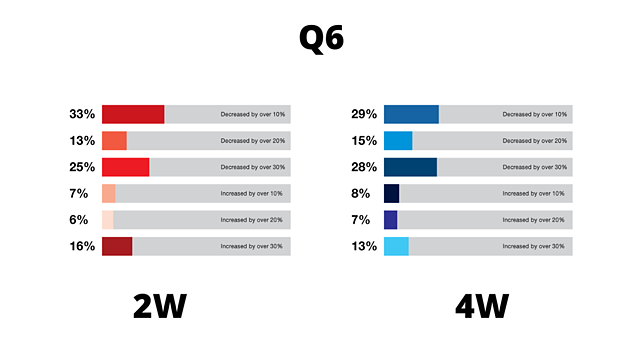
A key consideration for any consumer in his or her decision to purchase a vehicle is the budget. What has been the impact on budgets due to the outbreak, we asked. Over the past year, a significant 71% of respondents in the 2W category have reduced their budget for vehicle purchase by 10% to 30%, while budget for the remaining 29% respondents increased by 10% to 30%.
In the 4W category, a similar 72% of respondents are considering a budget decrease in the range of 10% to 30%. An approximate 29% said their budget has reduced by over 10%, while there was a budget cut of 20% for 15% of our respondents. Close to a third of the respondents (28%) have undertaken a budget decrease of over 30%. On the other hand, our survey found 8% respondents looking to increase their budgets by 10%, 7% increasing their vehicle purchase budgets by over 20% and 15% of those surveyed are looking at a budget hike of over 30%.
Q7. INTENT TO PURCHASE AN EV NOW THAN IN PREVIOUS YEAR
(Base Description: Those who said “Yes”/ “May be” in Q1)
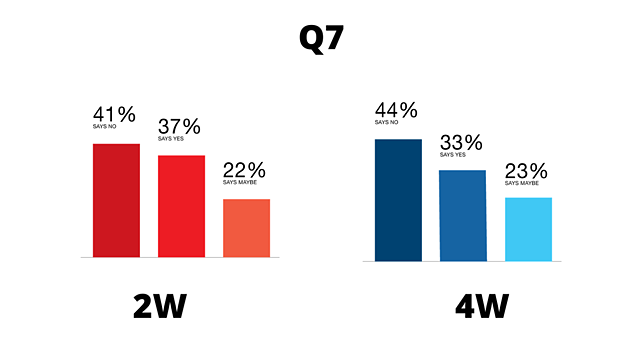
Over one-third of those surveyed – 37% in the 2W category and 33% in the 4W category – wish to purchase an electric vehicle now as compared to last year. About 41% of 2W respondents and 44% of 4W respondents were not keen on investing in EVs this year, while an approximate 22% of respondents across both categories remain indecisive.
Q8. CHANGES FROM LAST YEAR INFLUENCING EV PURCHASE DECISION
(% Description: Multiple)
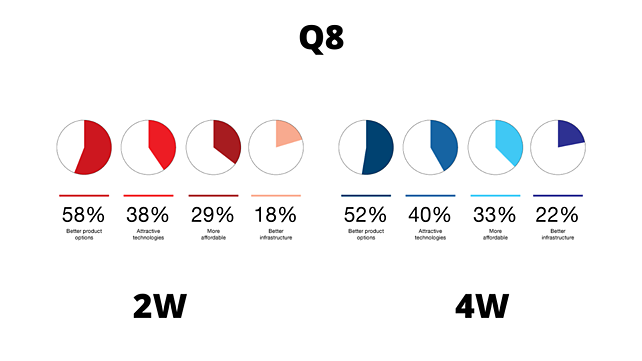
Better product options primarily seem to be driving the EV purchase decision among consumers. About 55% on average – 58% of 2W consumers and 52% of 4W consumers – felt better product options are strongly influencing their decisions to consider buying EVs this year. 38% of 2W respondents and 40% of 4W respondents appreciated the introduction of attractive technologies, while 29% among 2W respondents and 33% among 4W respondents find EVs more affordable this year compared to the previous year. About 20% of those surveyed voted positively for better infrastructure.
Q9. REASONS FOR NOT CONSIDERING EV PURCHASE
(Base Description: Those who said “No” in Q7)
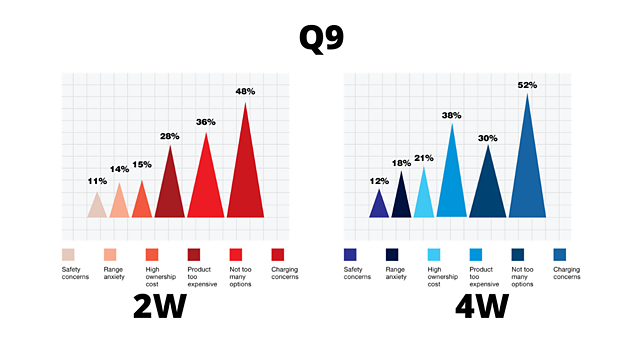
Responses to this question clearly found that concerns about charging is the topmost barrier in consumers not keen on buying EVs at this stage, followed by unavailability of adequate options and high cost. In fact, half of the total respondents to this question put charging concerns as the topmost reason for not opting for EVs. An estimated 36% of 2W respondents and 33% of 4W respondents weren’t too excited with the number of product options available in the market currently. 28% of 2W and 38% of 4W consumers felt the prices of EVs are still very high. High ownership cost at 15% (2W) and 21% (4W); rage anxiety at 14% (2W) and 18% (4W) were the next few reasons not to buy EVs. About 12-13% opted for safety concerns as their reason not to buy an EV this year.
Q10. BODY TYPE MOST LIKELY TO PURCHASE
(Base Description: Those who said “Yes/May be” in Q1)
Consumer choice with regards to body types reflected some interesting findings. In the 2W category, almost half of the surveyed consumers (49%) preferred motorcycles smaller than 350 cc, 32% wanted scooters, 13% preferred motorcycles over 500 cc engine size, while a small number of consumers (5%) opted for mopeds.
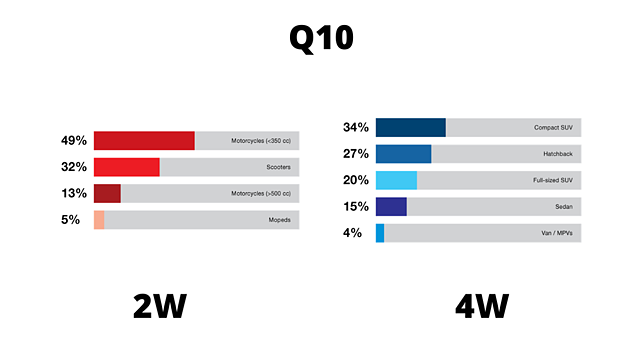
In the 4W category, compact SUVs continued to rule the roost with over one-third of those polled (34%) preferring this category of vehicles. Hatchbacks and full-sized SUVs followed with 27% and 20% preference respectively, while sedans came fourth with a 15% approval rate. MPVs/Vans were preferred by about 4% of the total surveyed.
Q11. PREFERRED TYPE OF OWNERSHIP FOR NEXT VEHICLE
(Base Description: Those who said “Yes/May be” in Q1)
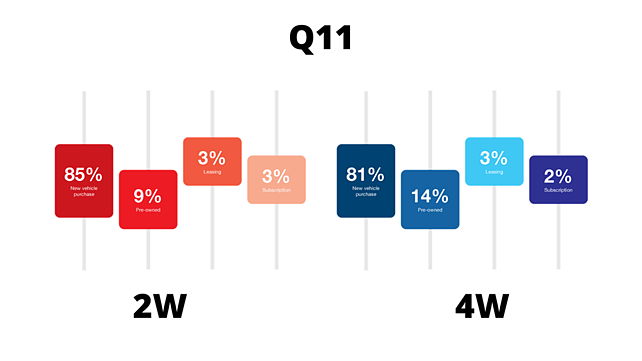
While a majority of respondents prefer to buy a new vehicle (approximately 83% on average), interestingly, a healthy 17% of the respondents were willing to experiment with other options such as pre-owned vehicles (~ 12%), leasing (3%) as well as subscription (~3%). This is an interesting trend for manufacturers to look up to.
Q12. WILLINGNESS TO PURCHASE A VEHICLE ONLINE
(Base Description: Those who said “Yes/May be” in Q1)
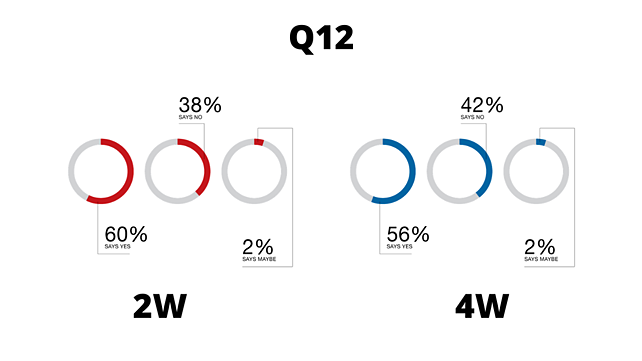
The growing comfort levels among consumers for online purchases were clearly visible in our survey this year, with almost 60% of the respondents willing to purchase a vehicle online. In the 2W category, an estimated 60% said yes to online purchase, while 2% were still indecisive. Among 4W consumers, 42% were still not willing to make an online vehicle purchase.
Q13. REASONS TO PURCHASE VEHICLE ONLINE
(Base Description: Those who said “Yes” in Q12)
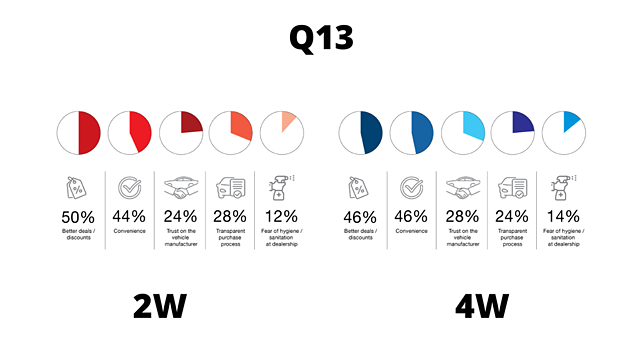
We followed the question on consumers’ willingness to purchase a vehicle online by asking them the reasons why they would want to make on online purchase. An estimated 48% respondents appreciated the better deals and discounts offered online (50% among 2W consumers and 46% among 4W consumers), while 45% voted for the convenience online shopping offers (44% in 2W, 46% in 4W). Trust on the vehicle manufacturer and a transparent purchase process at 26% respectively followed. Fear of hygiene/ sanitation at dealerships was rated the lowest at 13%.
Q14. REASONS FOR NOT PURCHASING VEHICLE ONLINE
(Base Description: Those who said “No” in Q12)
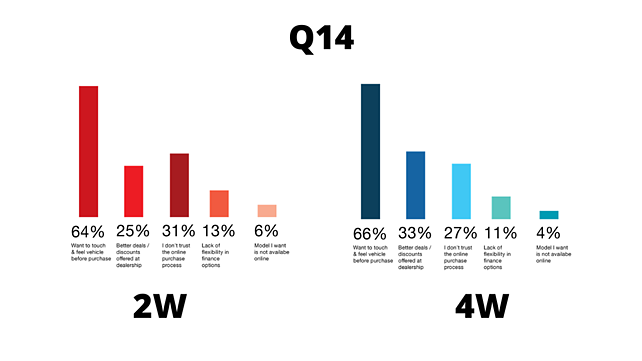
Similarly, we asked consumers to tell us the reasons they weren’t comfortable shopping online for vehicles. Lack of the opportunity to touch and feel is the primary barrier to online vehicle purchase, with 64% of 2W respondents and 66% of 4W respondents voting for this option. An approximate average of 29% of the respondents (25% in 2W, 33% in 4W) expected better deals and discounts at dealerships, while a similar 29% (31% in 2W, 27% in 4W) said they don’t trust the online purchase process. Lack of flexibility in finance options (12%) and non-availability of a preferred model online (5%) completed the survey for this question.
Q15. PREFERRED TYPE OF OWNERSHIP OF NEW VEHICLE
(Base Description: Those who said “Yes/May be” in Q1)
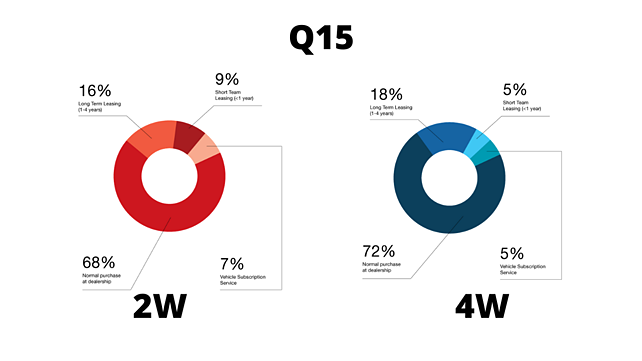
Of the total lot of consumers surveyed, 70% prefers to opt for normal purchase at dealership. 68% among 2W consumers and 72% of 4W consumers would want to walk into a dealership to buy their next vehicles. Long-term leasing (1-4 years) was the next favoured option at 16% and 18% among 2W and 4W consumers, while short-term leasing (less than one year) found favour with an average of 7% respondents across both categories. A small sample of 6% opted for vehicle subscription service as their preferred type of ownership of a new vehicle.
Q16. AVENUES TO FINANCE THE NEXT VEHICLE PURCHASE
(Base Description: Those who said “Yes/May be” in Q1)
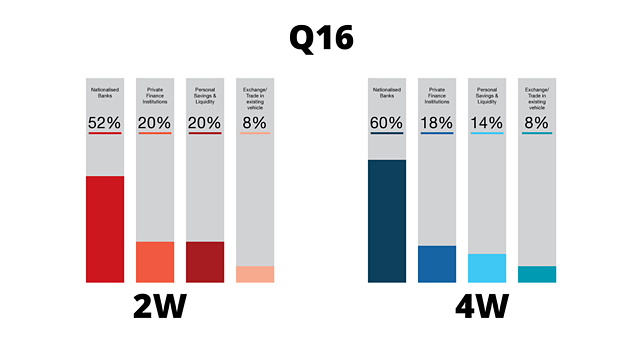
Nationalised Banks continue to be the most favoured, when it comes to financing the next set of wheels for consumers. In the 2W category, 52% preferred nationalised banks, while 60% in the 4W category opted to go with banks. Banks were followed by private finance institutions at 19%, while personal savings and liquidity found favour with 17% of our respondents (20% in 2W, 14% in 4W). 8% of the consumers surveyed wished to exchange or trade-in their existing vehicles.
Q17. REASONS FOR NOT INTENDING TO PURCHASE A VEHICLE THIS YEAR
(Base Description: Those who said “No” in Q1)
Of the total consumers who responded to this question in the 2W category, 41% said they were happy with their current vehicle, while 27% factored in budgetary constraints as their reason for not intending to buy a vehicle this year. An estimated 15% said they were willing to wait for a new model to be launched, and 9% preferred using public transportation for their travel needs. 8% of those surveyed did not want to buy a vehicle this year as they have recently bought a new vehicle.
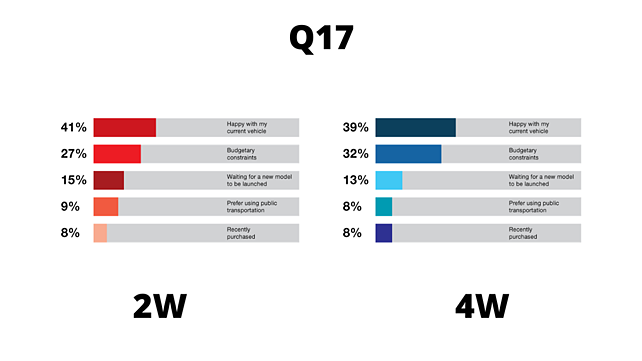
Likewise, in the 4W space, 39% of those surveyed expressed happiness with their current vehicle and an estimated 32% voted for budgetary constraints as the reason why they would stay away from making a vehicle purchase this year. About 13% of respondents in this category were waiting for a new model to be lunched, while 8% preferred using public transportation. A similar 8% of respondents said they recently bought a vehicle.
Q18. TIMELINE FOR VEHICLE PURCHASE
(Base Description: Those who said “No” in Q1)
In all likelihood, consumers preferred to purchase a vehicle within the next two and half years, on average. One-third of the respondents in the 2W space said they would buy their next vehicle in three to four years, while 41% are looking at buying their next vehicle next year. An estimated 27% of respondents want to buy their next vehicle in two to three years.
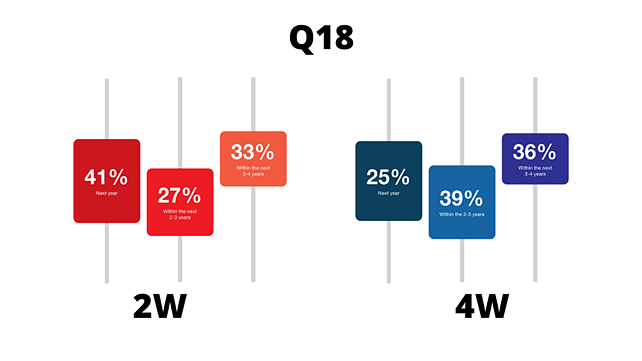
In the 4W category, one-fourth of the respondents are looking at buying a vehicle next year, while 39% wishes to make a purchase in the next two to three years. The remaining 36% in this category would consider buying their next vehicle in the next three to four years.